The (smooth) Mandelbrot Set
After experimenting with ChatGPT to create fractal generators, I decided to make one myself. I did so with the help of a wikipedia article called "Plotting the Mandelbrot Set". If you're new to coding and looking for a fun, low effort/high reward project to work on I'd definitively give the Mandelbrot set a try, I've attempted to make a tutorial on the bottom of the page. This is my most polished, and longest running project I've been working on, and also the only fun one :).
Controls
Arrow keys/drag the mouse to move
Q/E to zoom in/out
+/- to in/decrease the maximum amount of iterations
A/Z to in/decrease samples
B to toggle biomorphs
[/] to change the biomorph value
O/P to in/decrease the bailout value
S to toggle smooth coloring
R to "respawn"
1/2/3/4/5 to change fractal
Tap/hold J to explore julia sets
U/I to downscale the image
F11 to toggle fullscreen
Compile with:g++ mandel.cpp -o mandel -lGL -lGLU -lglut -Ofast
How it works
So, the general idea of plotting the mandelbrot set is to run the formula "z=z^2+c" for a limited amount of iterations, for every pixel. The variables "z" and "c" are complex numbers. Z is initialized to be (0,0i), and c is a certain value, like a coordinate grid. To do this in code without using complex numbers, but simple numbers, is quite tricky. People have found a way to do it, I put it in the tutorial below. I am not quite sure how it works, but it sure does :).
How to plot the Mandelbrot set using C++/openGL glut.h
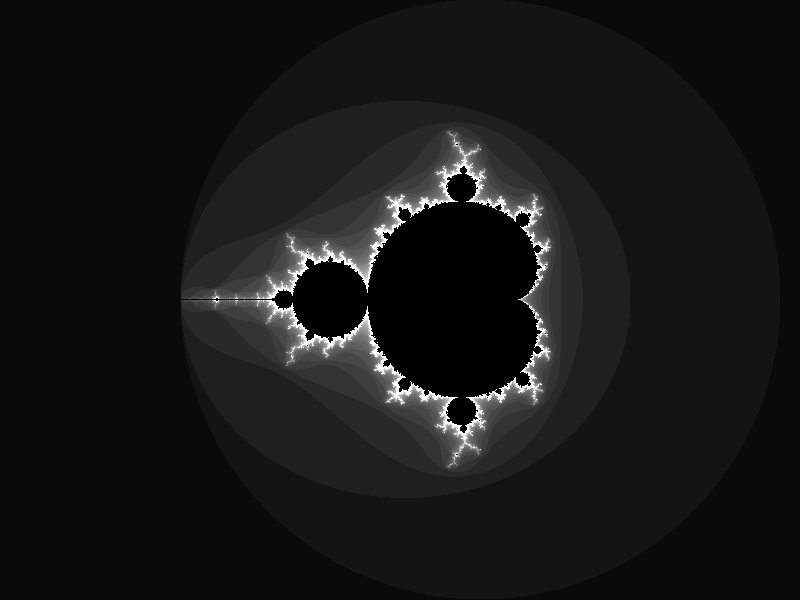
Some images


copyleft go steal it or something